EDA | 2019 Happiness Index
- mellishamallikage
- Apr 11, 2022
- 6 min read
Updated: Aug 29, 2022
What determines if the happiness of the population?

Introduction
Created in 2012, the world happiness report and the supporting data gained prominence when Bhutan announced it would be using GNH (Gross National happiness) rather than the GDP (gross domestic product) to measure the nation's well being. (Thimphu, 2012) The discourse around the happiness index remains divided with some arguing that the index is subjective whilst other s argue that it is a more sustainable measure than GDP (Merrick, 2015).
Leaving aside these arguments, what can be ascertained from index? Examine the 2019 happiness index, this project will aim to understand trends which may determine the happiness of a nation. to identify some of the trends in the dataset and factors which contribute to the happiness of a country. The index uses several factors to assess the happiness of nations and scores them accordingly. The factors reviewed include:
'GDP per capita',
'Social support',
'Healthy life expectancy',
'Freedom to make life choices',
'Generosity',
'Perceptions of corruption'
Overview
The dataset is relatively clear and does not require any major data clearing. However, it should be noted that the some argue that regarding the accuracy of government data especially in poorer nations were resources are limited (The Economist, 2011).
The dataset consists of various indicators such as GDP and life expectancy. It also holds subjective markers such as perception of corruption and freedom to make life choices too.


The dataset holds information for 156 entries each with a unique overall ranking. There are also no null values. The majority of the data are numerical.
It should be noted that the score is not a simple aggregate of other numerical values such as GDP and life expectancy.
The distribution of the numerical values are as follows.

Score
The most pivotal element of the happiness index is the scores column.

As a float, each value is too unique to identify a single variable on its own. Therefore, rounding the data to two decimal places, provides information of the low. This should capture some of the uniqueness of the scores whilst also enabling the scores to be grouped together.
This process reveals that whilst average (mean) is at around 5.41, the most common score (mode) was 5.89, thus the mode is higher the mean.
Looking at the data visually, it seems that the data is centred around the 4-7. However unlike typical distributions it does not have a clear peak, which is likely to be due to the distribution of the mean and mode values. This distribution could be for a plethora of reasons such as groups of nations sharing similar GDP or other factors.

Unhappy nations
Digging deeper into the score, the lowest scoring nations can be identified. It is clear that a nation with a low score will have a low ranking.

However, no single factor appears to fully explain why these nations appear to explain why they have such a low happiness. There are some clues to indicate possible causes but they do not appear to be the rule.
For instance, 3 of the 5 nations have a "Freedom to make choices" rate that is below 25%, 0.308000. However just because there is a low level of freedom in a nation, it does not dictate that the nation's population will be unhappy. Likewise, although Rwanda and Tanzania's population have more freedom, their population remain unhappy.

Likewise, GDP also seems to provide some reasoning regarding why these nations appear with such low scores (i.e. majority of the countries are significantly below 25% of the overall GDP figures). However once again, it does not explain the dynamics perfectly.

This finding is further supported by combining the two factors and combining the variables with the scores.

Explanations for Rwanda and Tanzania having low scores have not been identified in GDP or Freedom and therefore continue to remain excluded in the below table too.
Therefore one could assume that happiness is dictated not by a sole factor but a combination of variables.
GDP and Happiness

Pivoting from the low GDP and exploring the nations with the high GDP shows that the relationship between the Scores and GDP may have altered. For instance, no nation in the top 5 GDP is ranked 1-10 for overall happiness. It is not until the list is expanded to the top 10 GDP scores does nations such as Norway and Switzerland appear. (Ranked 3 and 6 respectively overall for happiness) .This may allude to the fact that GDP may have a diminishing marginal return in relation to Scores (BER 2018) .
The graphical view of the data confirms this relationship, though in this dataset, it is not as pronounced. The scatter shows that the data has a curved relationship and the error in the line of best fit increases at the top and bottom end of the data.
Relationships between variables
Expanding this further, the below is a set of graphs highlights the relationships between various datasets. A number of the categories show a strong relationship with one another, however they are nonlinear. Furthermore, some captures have a cap or should lie within a specific established range. For instance, no human lives forever. Therefore regardless of other factors such as GDP, the “Healthy life expectancy” must plateau at some point. As financial flexibility increases individuals may have better access to healthcare thus increasing life expectancy. Freedom to make life choices also must have an upper limit - an individual can be free to accept a choice but they cannot be “too free”.

Moreover, it seems that generosity as a whole has a weak relationship to other data. In contrast, the strongest relationships are those amongst Score, GDP, social support and life expectancy, compared to freedom and generosity, perception of corruption.

Generosity and Social Support

Although the heatmap shows a weak relationship, based on the 2019 data, is it correct in assuming a more generous population has a better social support system? Or, do politicians rely on that generosity to have limited social support with the assumption that the public will support those in need.
Based on the below graph, it appears that as generosity increases, the social support does indeed decrease. However the extent is approx. 0.2 points.
Choropleth of Happiness Score
Finally, how does the happiness scores reflect when plotted on a geo map?
As the Choropleth highlights poorer nations in Africa and South Asian nations appear to have a low level of happiness. On the other hand, wealthier nations such as north America, Australia and north Europe have high levels of happiness.
Author's notes: For interactive graph, please see the Kaggle Notebook.
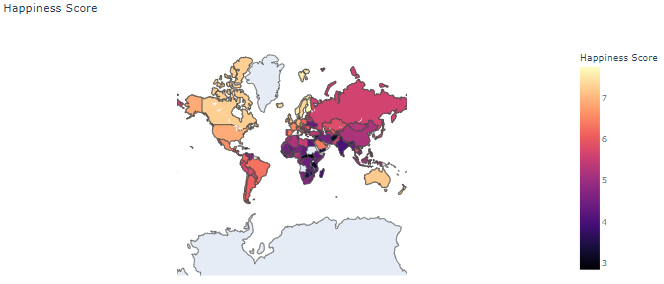

It is interesting to note that east Asian nations have a low degree of happiness, relative to other wealthier nations. This is mirrored by the OECD data on suicides which ranks countries such as Korea and Japan at the top (OECD, 2021). There are extensive literature regarding this issue with some causes for low happiness being related to poor work life balance, leading to issues such as Karoushi (McCurry, 2017).
Conclusion
Happiness is a very subjective topic and can differ from day to day and individual to individual. However understanding happiness may be a better marker for assessing a wellbeing of a population compared to GDP alone. This also should be more sustainable as the focus is not on production or consumption.
Subsequently, to maintain an even playing filed to assess happiness, an index evaluating various variables have been created. Even these variables are prone to issues from inaccurate reporting from poorer nations with limited resources to the population not recognising that they are lacking in freedom or are contempt in their lack of freedoms.
Regardless, the index shows that for those residing in poorer nations, economic security is a key factor dictating their happiness. This is justified as such individuals are more likely to have concerns centring around basic needs, limited access to healthcare etc. However as finances improve, its impact on happiness decreases (diminishing marginal returns). The importance of well being in such cases tilts towards freedom and other factors. This alludes to the popular saying "money doesn't buy happiness".
Finally, it should be noted that these indexes are a generalisation. individuals in unhappy nations, can be extremely. Likewise, unhappy individuals in happy nations are valid and should not be disregarded.
“Happiness is the meaning and the purpose of life, the whole aim and end of human existence.” ― Aristotle


Comments