EDA | Survey Data
- mellishamallikage
- Apr 11, 2022
- 9 min read
Updated: Feb 18, 2023
Critical evaluation of survey on reading habits and its effectiveness.

Introduction
Surveys are one of the most common sources of primary data, enabling the surveyor to ascertain information which may otherwise be unavailable. However, surveys are also sensitive to the bias of its creator, with leading questions and inaccurate results to name a few.
Subsequently, this project will examine a survey investigating reading habits and examine the reliability of the data and what issues should be considered when used. As the project will reveal, the data is less than ideal and has some of the typical issues surveys are sensitive to.
Overview

The reading habits dataset consists of responses to a survey from over 2000 individuals. Roughly half of the questions pertain to the individual such as age and race whilst the other half pertain to their reading habits. Identifying features appear to have been removed to maintain confidentiality.
The nature of the variables indicate that the survey was multiple choice. Therefore, there is a lack of detail and additional questions related to responses could not be asked.

There are also null values in the data indicating that participants opted out of answering some questions.
It should be noted that in this dataset, questions used to ascertain the results were not provided, as such, issues arising from bias questions will not be explored in this project. The project will limit itself to the responses and what it conveys about the quality of the dataset.
Examining Individual Variables
Typically, the surveyor would provide details concerning the survey. However, supporting documents for this dataset are limited. In addition, the surveyor's proficiency in survey methodology is also unclear. Consequently, individual variables in the data will be examined to identify potential weaknesses and strengths in the dataset.
Age
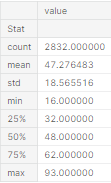
The first column in this dataset is numerical values representing the age of the participants. It shows that every participant provided a figure with the ages ranging from 16 to 93 years olds. Furthermore, the average participant was around 47years old.
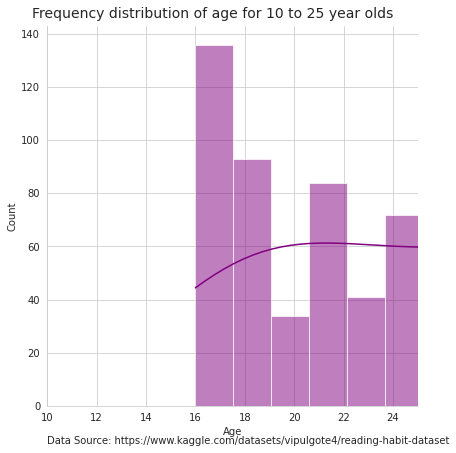
Below is a graphical representation of this data. The distribution of the data raises some concerns. There is an extremely high number of under 20s, compared to any other age group. Moreover the figure significantly drops in the next age bracket.

Focusing on the ages of 10-25, shows that the peak is focused on 16/17year olds. Moreover, further review indicates that there were 60 individuals who stated that they were 16, which accounts for 2.4% of the data.
There are various explanations for this high figure. For instance, part of the survey targeted 16 year olds specifically.
Alternatively, the lack of under 16s and lower volume of data for 17 year olds, could indicate an issue with the question. For instance, the question may have assumed no participant would be under the age of 16, but actual participants were. In this case, individuals may have selected the lowest available option, i.e. 16 year olds. Consequently, concluding remarks related to age should be made with caution as the data has some inconsistencies.
Sex
This is relatively straightforward with two criteria provided to participants and every participant selected one of the options. It indicates that the split in this dataset favours females as there are approx. 2.3% more females. The margin is such that it this gender split should not cause any major issues.
This is a common trend with older surveys, however, if this survey was rerun, it may be wise to include other classifications to accommodate for non-binary genders.
Race
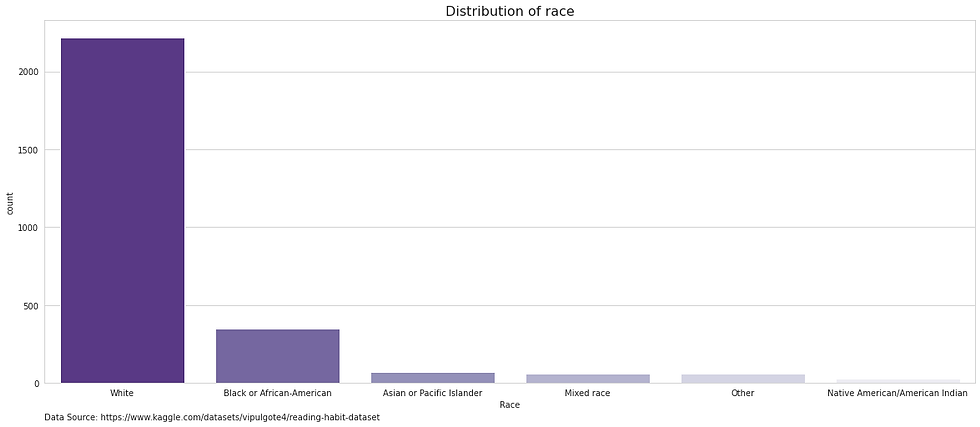
In contrast to sex, race appears to have a number of issues.

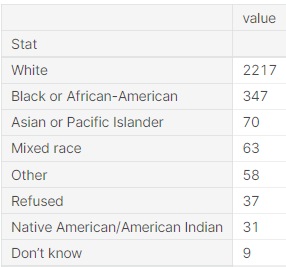
Firstly, the dataset is skewed in favour of those who identified as white, approx. 78% responded to the survey as white. On the surface, assuming that the survey was aimed at the US market, seems logical.
However, according to one source (Ghosh, 2020), the US diversity in 2019 was as follows:
White: 60.1% (Non-Hispanic)
Hispanic: 18.5%
Black: 12.2%
Asian: 5.6%
Multiple Races: 2.8%
American Indian/Alaska Native: 0.7%
Native Hawaiian/Other Pacific Islander: 0.2%
The above data is also supported by the most recent census results from the US which indicated that those who identified as white were just over 60%. Furthermore, according to these sources, Hispanics are a key race in the US. However, this is not included in the dataset.
Moreover, participants can often refuse to answer questions. In such cases, their responses should be considered null and be excluded in specific reviews. It should be noted that a participant who decided to decline from answering a question should not be completely excluded from the further review of the data. This may have a negative impact as one would be favouring people who are more forthcoming.
There are questions relating to the response “Don’t know”. Usually, individuals are expected to know their race and as such, the reasoning behind this response is unclear. Did participants really not know their race or were they bad actors were attempting to skew the results of the survey? Unfortunately, there is no way to gain further insight into the "don't know" responses. As such, for this project, it may be wise to regard such responses as also null values.
Following, these changes the distribution of race in this dataset is as follows.
Marital status
As the project continues this will become a persistent but some column names are less than ideal. These will be revised as the variables are explored. In the case of “Marital status?”, it will be transformed into “Marital status”.
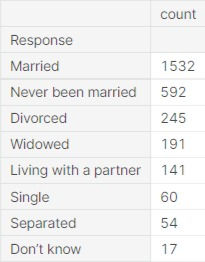
The questions assume participants are all in typical relationships and for those who are not in such relationships, there is no option. For example, assuming these were multiple choices, there is no option for those in a relationship but are not cohabiting. These too may be logged under "don't know".
Without rerunning the survey, there is no perfect way to rectify this issue. For the time being, the only approach is to treat "don't know" as null values.
Further review of the data highlights that it is skewed in favour of those who are married. As the data does not include any information on family dynamics it is unclear whether these individuals are also parents - an aspect which may affect reading habits due to time constraints.

Education
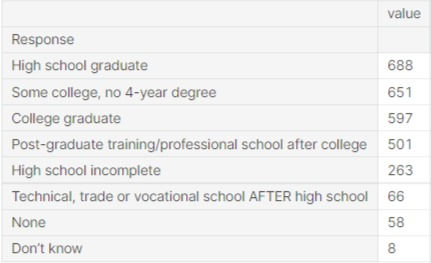
Similar to the marital status, the responses in this category seem to indicate issues with the quality of the questions. As established, the age of the participants ranged from 16-90+. Given this, there is a high possibility that 16 year olds are in High school based on age of graduation (Emigrate, 2019). If so, there should be a category for “in high school”. However, the only options for High school are “High School incomplete” and “High School graduate”. One could argue that those attending High school could opt for High school incomplete. If so, this option will include two different demographics. This is not ideal.
This is further apparent when the distribution of the age variable is compared against the educational achievement. There is a significant number of 20 and under individuals who have selected "High school incomplete".
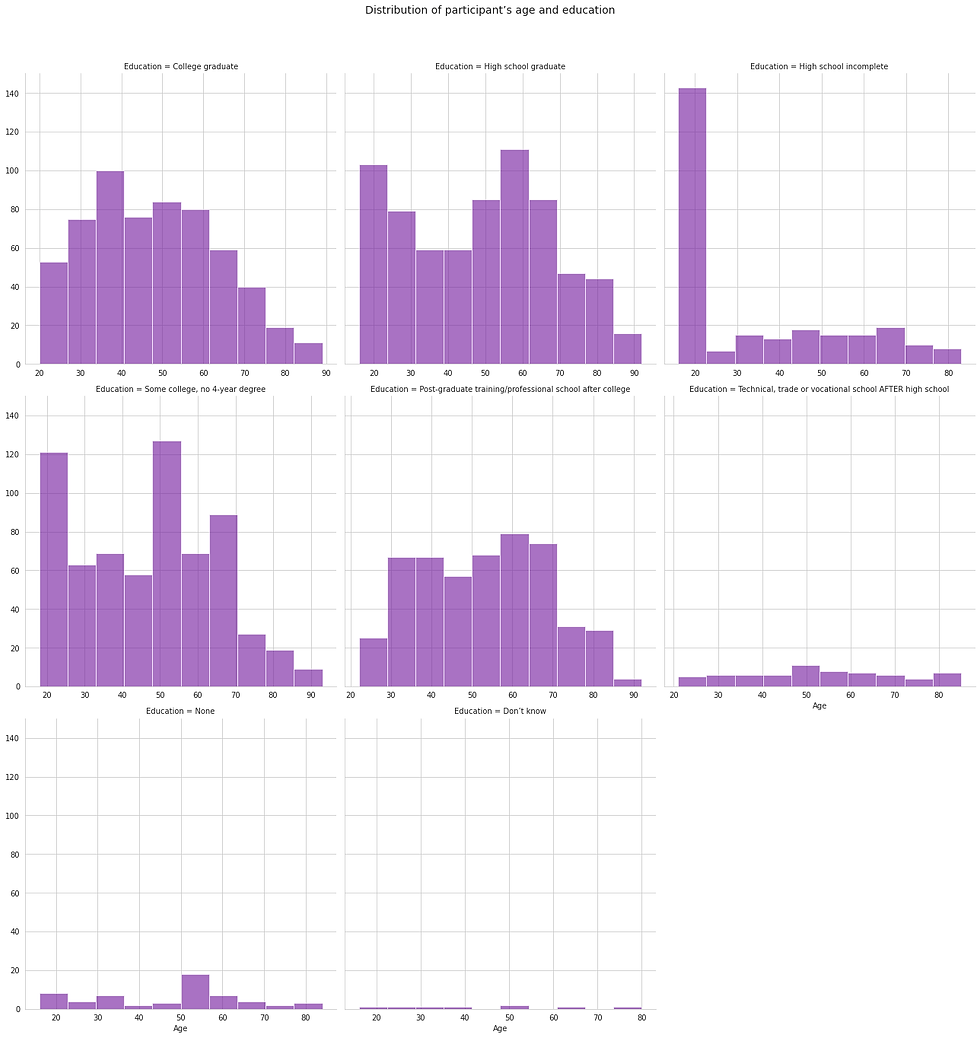
Furthermore, “None” and “Don’t know” are ill defined. It is unclear if it refers to those who wished not to disclose their education, those that did not attend high school at all or found that the other categories did not reflect them adequately. One fear is that if an individual who was under 16 participated in this survey, they may have selected one of these options. This is especially concerning as the “None” responses account for 2% of the total dataset.
Unfortunately given the nature of the survey, there are limited alternatives to classifying “None” and “Don’t know” as null values. Assumptions could be made based on the age of the participant and reclassify them to “in High school” but this will sacrifice accuracy.
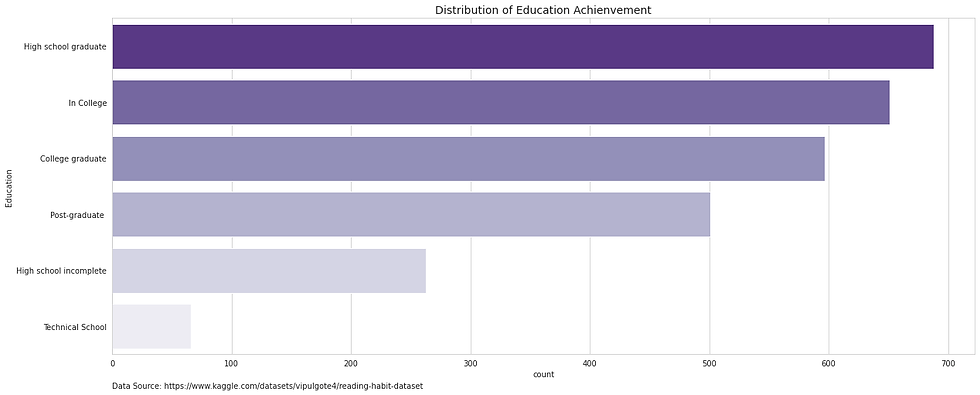
Alongside revising “none” and “don’t know” to null values, it may be wise to revise the category names to a more aesthetic name, whilst attempting to ensure the responses remain accurate.
Employment

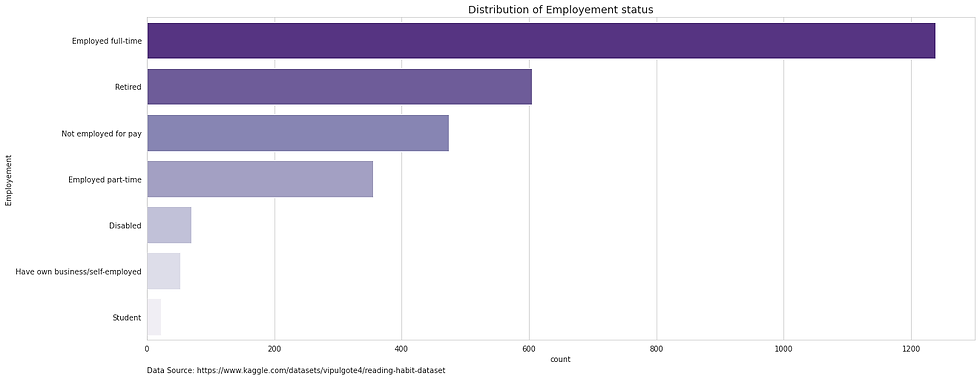
Employment appears to be relatively straightforward with no major issues.
"Other" responses have been revised to null values as such responses are unlikely to be illuminating without further follow up questions.
It is clear that based on the majority of the responses the employment status favours "employed full time".
Incomes

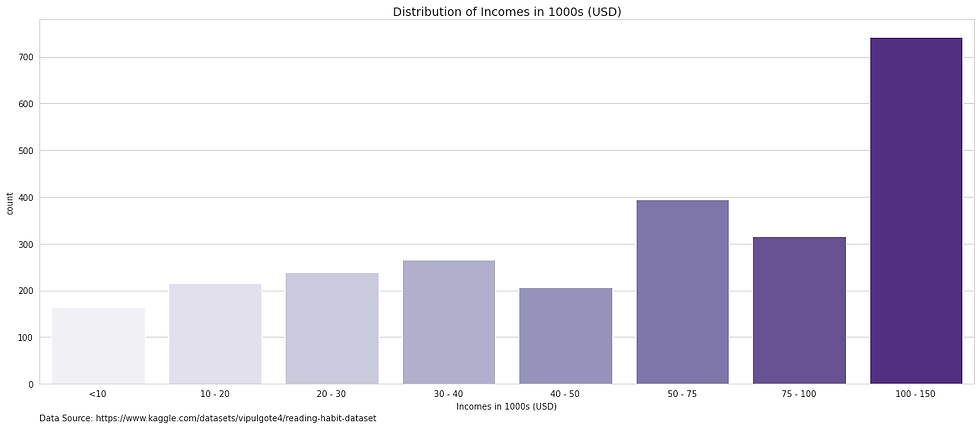
Income may be the weakest variable with a plethora of issues.
There is a typo in the categories as one includes an additional 9 before the dollar sign.
Furthermore, caution should be exercised when comparing one category against another. 100-150 is the most popular income group. However, it is also the largest income window with over USD 50,000 income difference between the lowest and highest paid within this category. In contrast, for the second most popular category there is USD 25,000 difference. The difference is smallest for the lower earning groups. This creates the impression that most participants were wealthy when that may not be necessary.
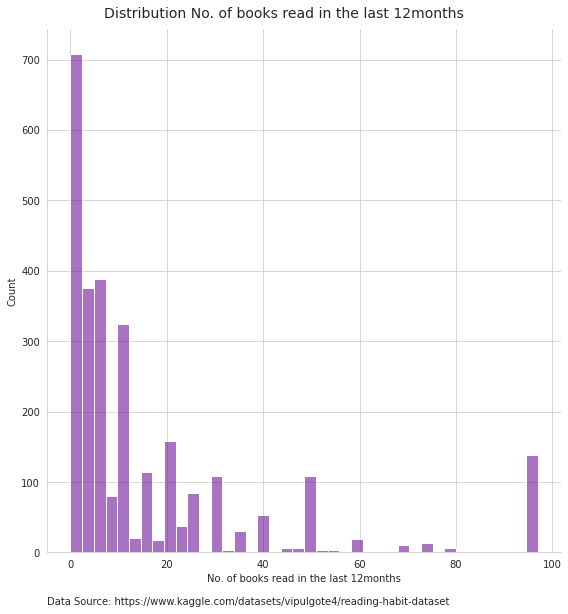
No. of books read in the last 12 months
From this variable, the dataset shifts and explores the reading habits of the participants.
Column name revised for improved readability.
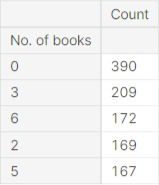
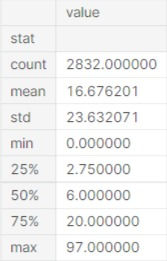
Examining the breakdown of the data, there are a high number of participants that state that they did not read any books. In fact, over 38% of individuals read less than 5 books with a large number of individuals reading 0 books.
However, the distribution of results is extremely broad with some reporting that they have read over 40 books and the highest number of books read was 97.
It should be noted that, these results are likely to vary based on target sample audience. Results will change if the survey is run on Goodreads users vs individuals attending a E-sports event. Based on the distribution, it may be a broad demography unshaped by such variables.
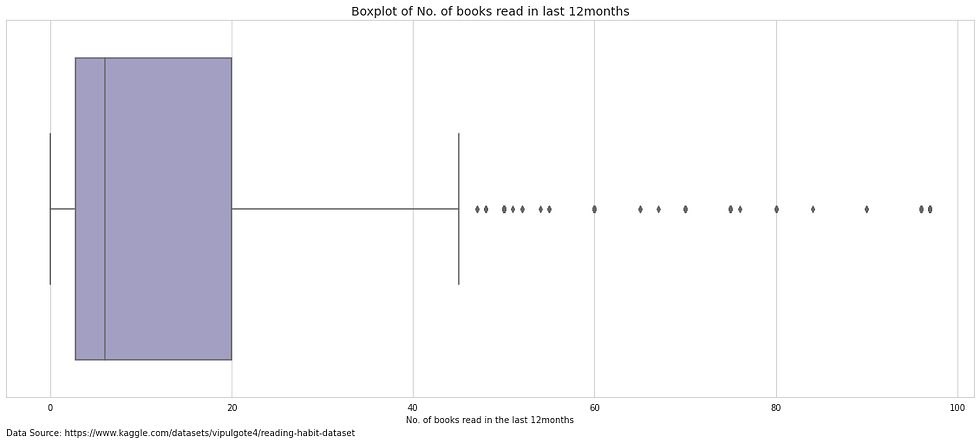
Reviewing the data in a box plot indicates that for this dataset, individuals who read 30 or more books is an outlier.
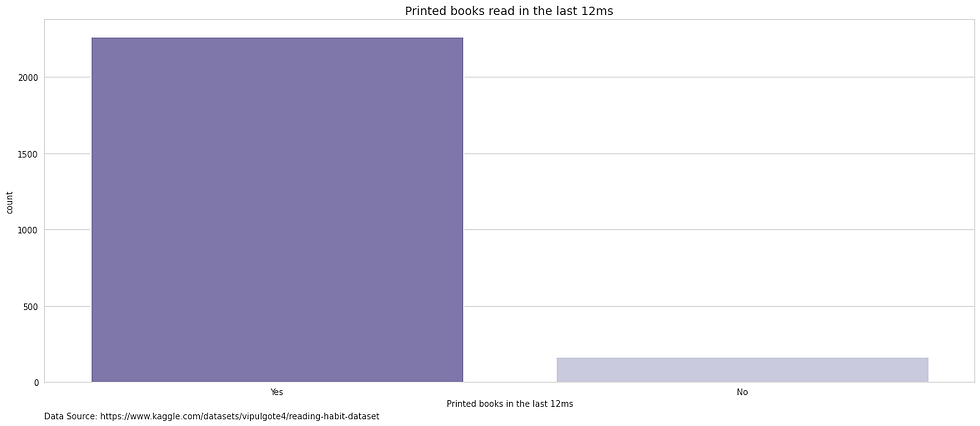
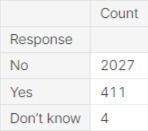
Printed books read in the last 12 months
Column name revised for improved readability

Once again, “Don’t know”, will be considered as null values. This response is not unusual given the context of the question. Excluding the null values, the majority of respondents read at least one printed book over the past 12 months.
As an avid reader, it is curious what types of books the readers had read. For instance, publish books can cover a wide range from comics to fiction and non-fiction. However there is no such calcification in this dataset.
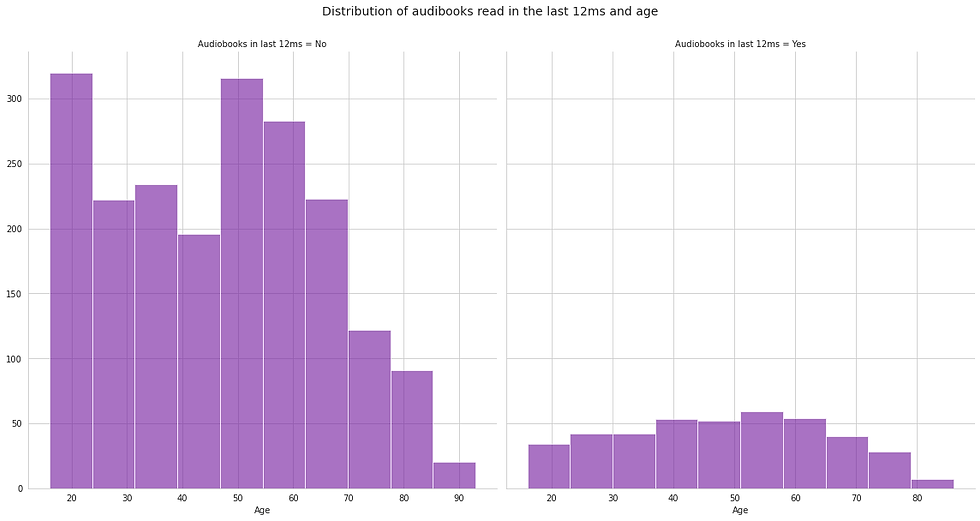
Audio and eBooks
Column name revised for improved readability
Published two years ago, one may assume that the dataset if it were to capture the popularity of audiobooks would have done so. Therefore, it appears that for this survey, audiobooks were not a popular method of consuming books. Examining the popular of platforms such as Libby and Audible, the impression is that audiobooks are more popular but further investigation using external data will be required to confirm this.
Evaluating the use of audiobooks against age, sadly does not agree with a possible hypothesis of audiobooks being popular with the younger age groups. However, it is unclear if this is attributed to the general popularity of audiobooks or the skewed nature of the dataset. For example, younger individuals into gaming may read less books than those active in BookTube.

Aspects identified in audiobooks is also replicated in e-books.
Once again the majority of the readers participants had not read a book.
Method of obtaining previous book
Column name revised for improved readability
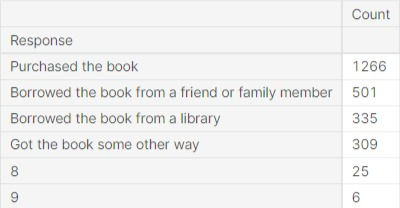
The name of the column is somewhat poor but the content of the data reveals that it is a list of methods by which the participant obtained their previous book.
Additionally, there are data entry errors - i.e. values 8 and 9. Unfortunately these records cannot be salvaged. These values need to be dropped/set to null.
This leaves the dataset with a high number of individuals who purchased a book followed by those that borrowed from a friend/family and the library. Sadly, insight offered by "Other" is limited.

Daily newspapers & Magazines
Column name revised for improved readability
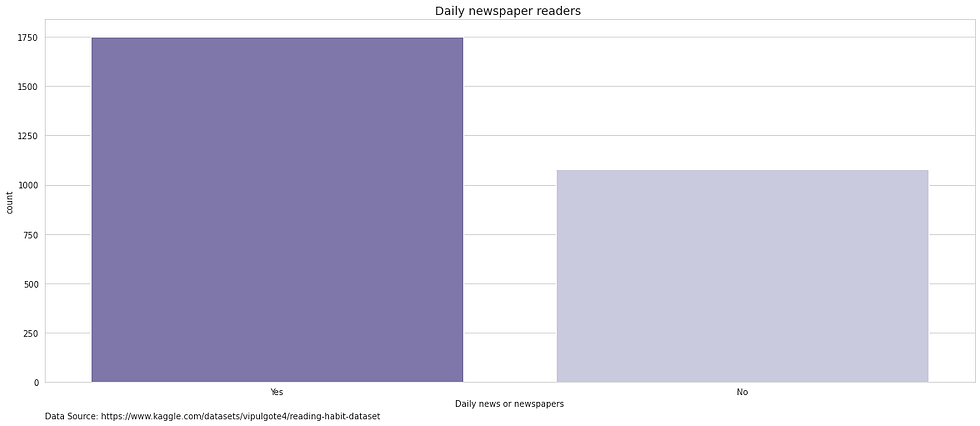
Unlike in the case of audiobooks and e-books, the reading habits surrounding newspapers and magazines appear to be more balance. In fact, solely based on this indicator, one could assume the participants are readers.
However, in the context of news papers, one question that arises is whether these individuals are reading for pleasure or for work. For instance, in some occupations it is beneficial to be aware of current affairs.

Reading magazines, likewise, has a similar distribution, i.e. although not 50%, 50% split, the difference between readers and non-readers is relatively small.
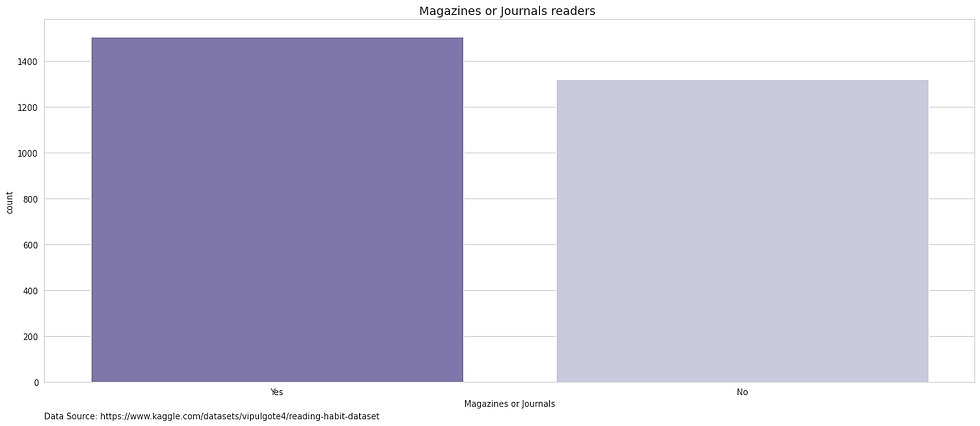
With magazines, the typical observation is that magazines are more popular with females. This is mirrored in this dataset as the majority of the participants who are female reporting that they had read a magazine or journal over the past 12months.

Conclusion
This has been a walk though of a dataset evaluating the quality of a survey relating to reading habits. As the project highlights there are several issues with the quality of the dataset. Specifically, after cleaning the dataset, the null values in the dataset has increased and is now as follows:
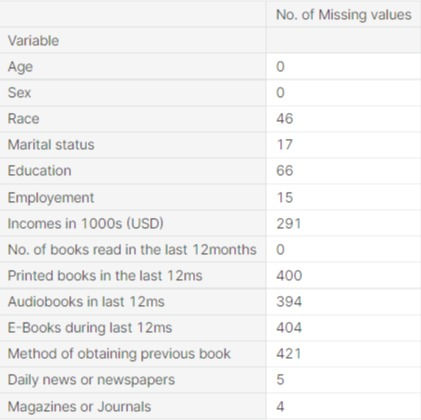
This change does not account for any other issues such as the lack of data recorded for under 16 year olds and questionable recording on high school /educational attainment.
As a reader, there is a curiosity regarding whether a model could be created to predict whether an individual will be a reader or not. However based on the quality of the data, there are concerns that the created model will not be robust enough to be applicable to the greater population.
“A reader lives a thousand lives before he dies, said Jojen. The man who never reads lives only one.” ― George R.R. Martin, A Dance with Dragons


Comments