Report | Modelling Flight prices
- mellishamallikage
- Feb 18, 2023
- 5 min read
Updated: Feb 19, 2023
Case study aiding a company understand their travel expenditure and creating a model to ensure their expenditure is appropriate.

Situation
A company in India wishes to have a better grasp upon their expenditure and in particular, travel expenditure. Their interactions with data science is limited and have asked for a report to:
whether they are overpaying for their flight tickets
understand how they spend their money
a system going forward to enable them to understand whether a ticket is appropriately priced.
They have provided a dataset of past tickets the have considered for their staff as part of their request.
Overview
The data provided by the company consists of over 3000 domestic flights in India. They consist of the following variables.

Variable | Data Type |
|---|---|
Airline | Categorical, Nominal |
Flight | Categorical, Nominal |
Source city | Categorical, Nominal |
Departure time | Ordinal |
Stops | Discrete |
Arrival time | Ordinal |
Destination city | Categorical, Nominal |
Class | Ordinal |
Duration | Interval |
Days left | Interval |
Based upon the client’s request, the report will explore each of the key factors that determine the purchase of a flight for the company and whether they had overpaid/underpaid for a ticket.
In the next step, a model will be created to enable the supplier to estimate the cost of a flight.
Assessing factors
The prices of the tickets is approx. 1105 to 123071. There some flights above 100,000 where the values are mathematical outliers. In other words, there is a likelihood that the client may have overpaid for these flights. This should be noted as further analysis may also be swayed by such figures.

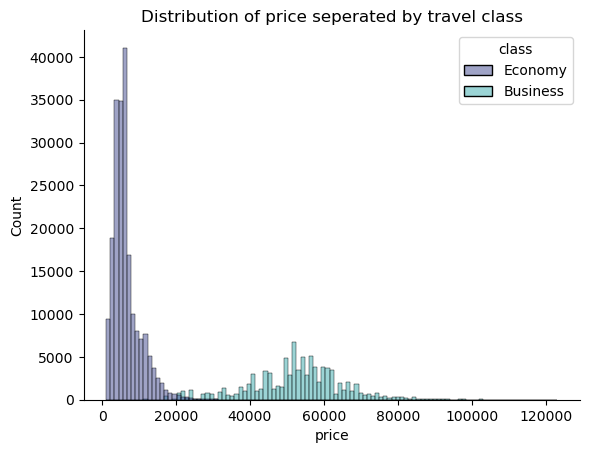
The data is centred around some specific and peak at around 15,000 and 50,000. Investigation relevels that a contributing factor to this is due to the flight class.
Class
This suspicion is confirmed by the following graph. For reference, the data is skewed in favour of economy flights as the data consists of over 69% of such flights.
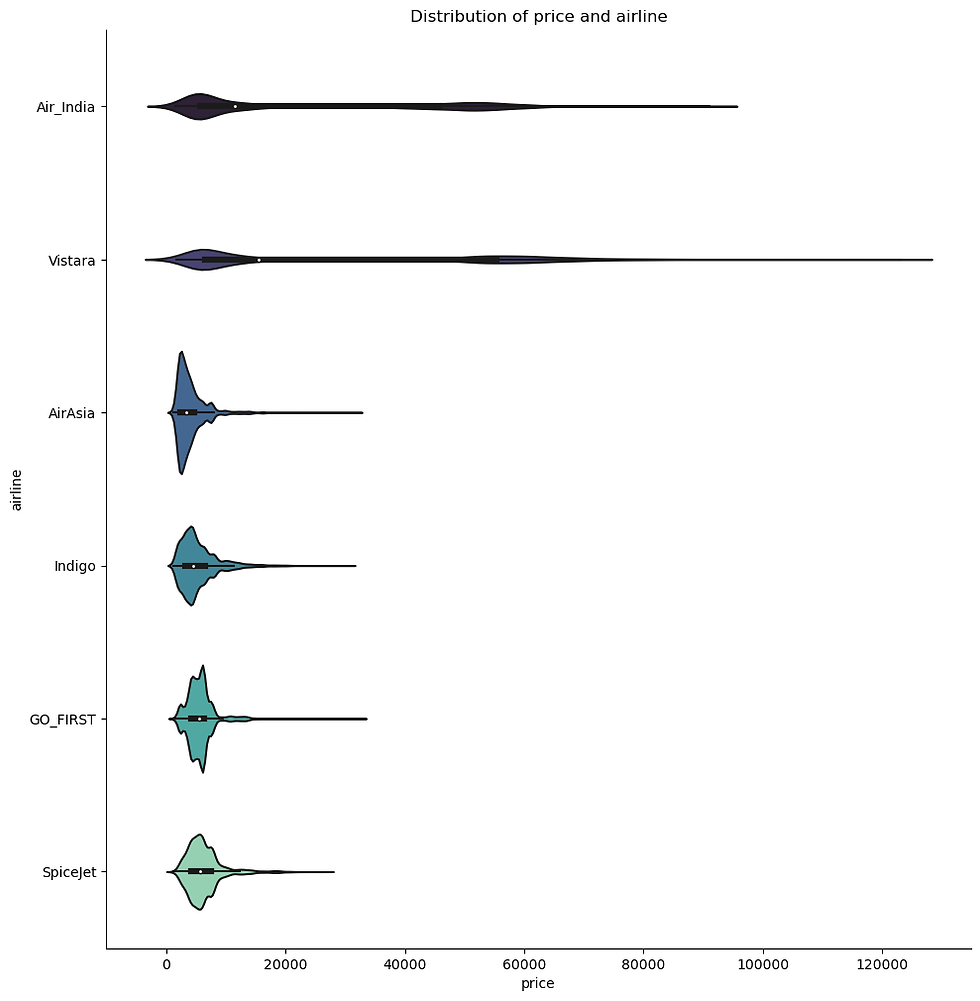
Airline

This dataset includes information for 6 different airlines. Their distribution is uneven with Vistara dominating the data whilst Spicejet's information is limited.
In terms of its impact on price, Vistara , not only has a large number of entries but also has a large distribution in the price. Spicejet's, in contrast, has a limited number of data but also its price ranges are concentrated.
Flight
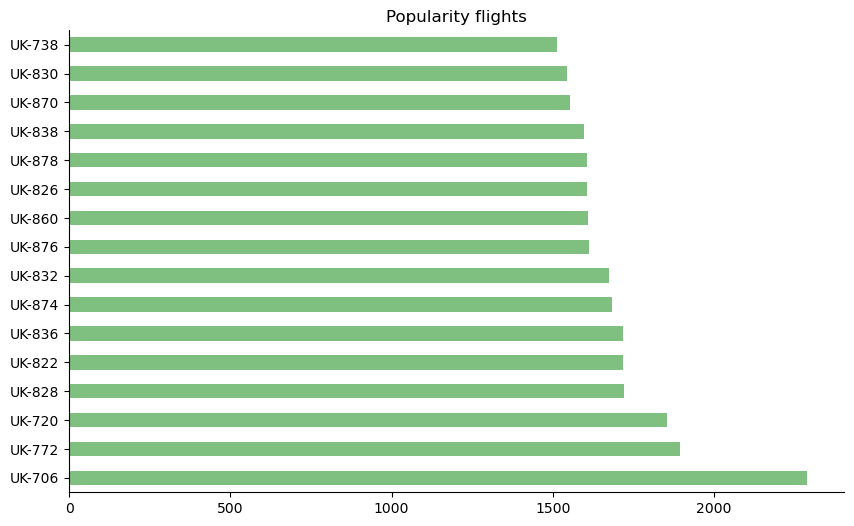
There are over 1500 different flights listed in this dataset. Flight UK-706 appears over 3000 times whilst G8-107 has only one data. As flights numbers can be repeated, the frequency variation is likely due to be related to the frequency in which the company sought specific routs and times.
Source and destination city
All flights travel to and from a set location in India. This includes Delhi, Mumbai, Bangalore, Kolkata, Hyderabad and Chennai. Bangalore and Chennai appears to have the biggest price ranges although it is not the most common value in the dataset.
 |  |
 |  |
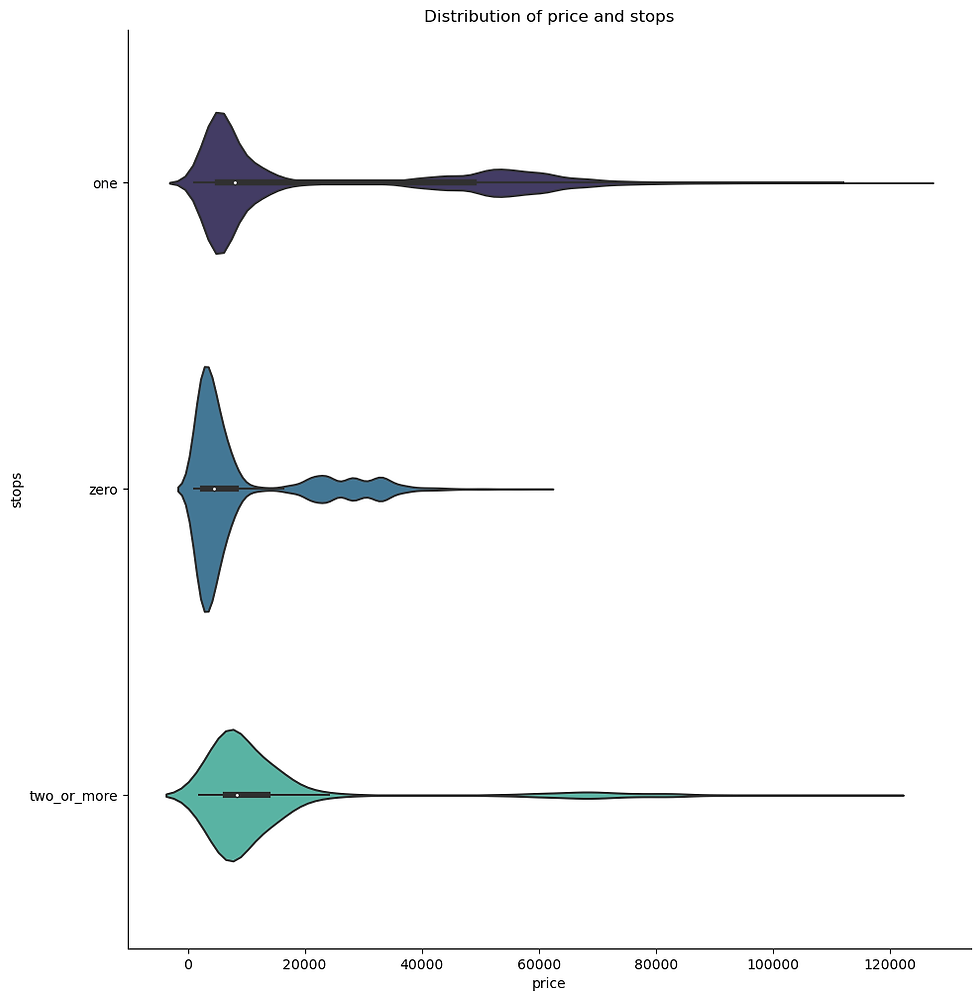
Stops
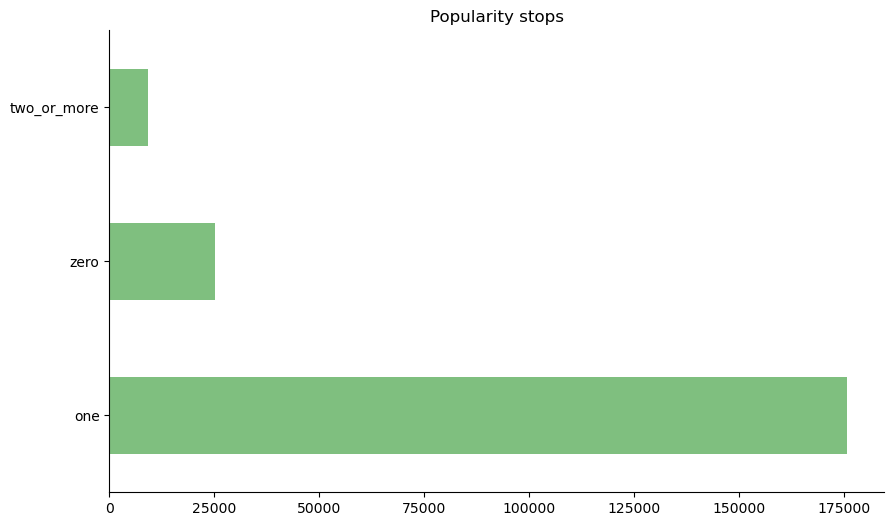
As far as this dataset is concerned, there are three types of flights. Direct (or zero stop) flights, one stop or those which have more than two.
Depending on the type of flight, the costs can vary drastically. Direct flights are more affordable whilst those with one stop has a larger distribution of prices.
Departure & arrival times
The departure and arrival times have been group into specific times. This grouping does reduce some information that can be gained from the data. That said, the nature of the field remains intact and thus ordinal. Whilst the volume of flights at specific times appear to vary, the prices of the flights appear to be relatively similarly distributed between each time set. However, due to the reduced variance for late night flights, they may be a safer choice if client wishes to avoid overpaying for tickets.
 |  |
 |  |
Duration
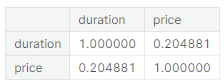
Durations are distributed with a positive skew, favouring shorter flights. This is logical as long distance travel is rare compared to short haul flights. Its correlation to price is around 0.2 and therefore limited.

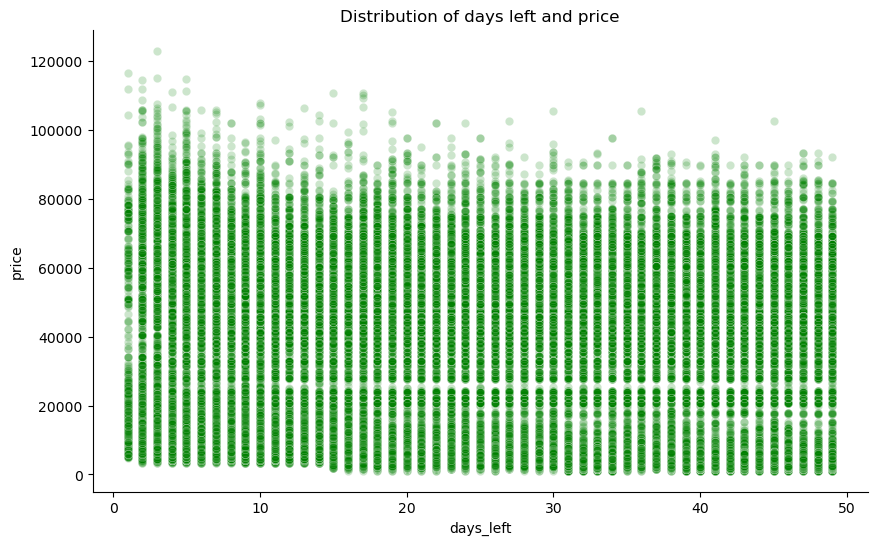
Days left
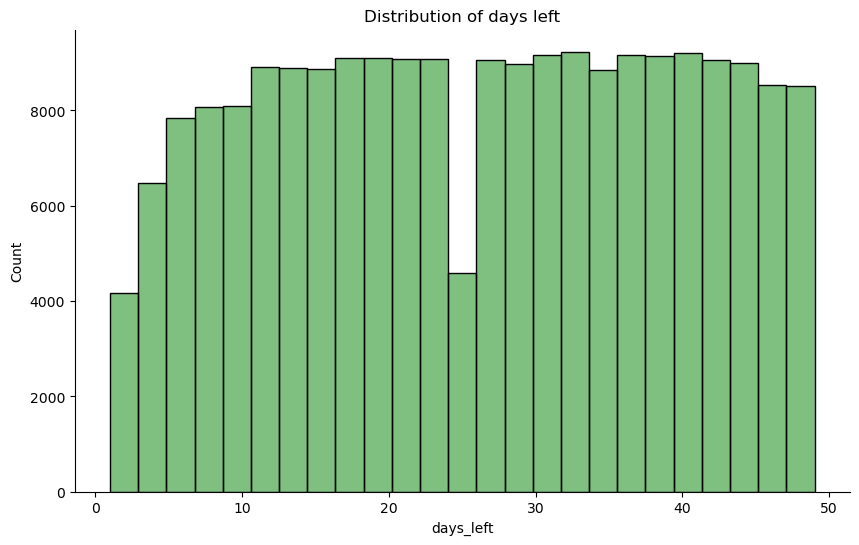
At the time of purchase, the flight day could be between 1 to 50 days in advance. Its variation between 15 to 45 days remains relatively even. Finally, its correlation with price is relatively weak. In other words, days has a limited impact on pricing.
Creating a system
The final request by the client is to have a system which would enable them to estimate the cost of a flight. This would act as a gauge of whether the cost is inline with market prices or not.
In order to achieve this, a data model/ machine learning is ideal.
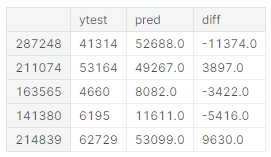
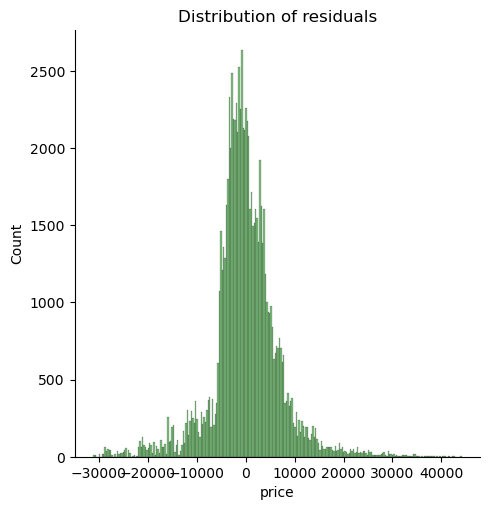
Given how the model will be utilised, the cost and other factors, simplicity may be ideal. Consequently, a linear model as follows could be utilised. As variables such as days left and duration that have a limited impact on price could be excluded from the model, also for this reason of simplicity.
Such a model would maintain and increase the usability of the model, it would also ensure that the accuracy of the model remained around 90%.
It is not a perfect system but as a company which has not utilised such models previously, this simplistic model may be a good starting point for them. It keeps their initial costs down whilst meeting their needs. If, in the future, they require more comprehensive predictions from such a model, alternatives could be explored. This is particularly the case as given the transformations undertaken such as encoding and scaling, client’s insights into how the model operates is limited. If they are uncomfortable with this, they may find it difficult to accustom to more complex models.
Limitations
It should be highlighted that periodically the client will need further assistance to retrain the model and ensure that the model is able toe predict prices inline with changing factors such as inflation.
Conclusion
The data indicates that the client is currently paying an appropriate amount for their flights given various factors such as travel class and destination. That said, if a ticket costs above 100,000, caution should be exercised.
A model with 90% accuracy has been created to enable the company to assess whether a flight is viable/ priced appropriately. Business travel will, as generally accepted, lead to increased expenditure. Vistara flights can vary in prices. Moreover, the client may be wise to avoid non-direct flights, especially those that have one stop as they can have more expensive tickets.
In contrast late night flights especially for departure may lead to reduced travel costs.
The client will require additional support going forward to ensure that the model is able to withstand changes such as inflation. If the client wishes to include international flights or more complex models, this may also be an option going forward.
Author’s notes: This is a slight different project style for me. However I like having projects that have a tangible link to wider world and for machine learning, this style seemed the best approach for me. I am also still relatively new to machine learning and many of the aspects covered in this project aim to draw upon the information listed in chapter 2 of Hands-on machine learning.
It should be highlighted that the situation above is fictional. However I have frequently come across this “fear” of the unknown presented in this project for companies still not engaged in maximising gains from dat. In such cases, they require handholding and staring slowly.
It should be highlighted that the data for this project is "Flight Price Prediction" hosted on Kaggle.


Comments